Ethiopia vs Colombia coffee: one exports its whole crop, one drinks two fifths of it.
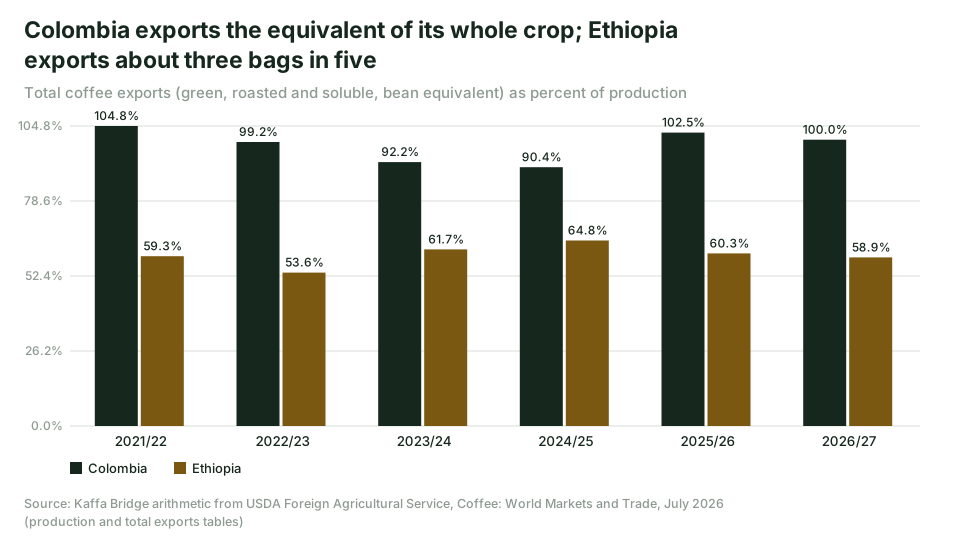
Ethiopia vs Colombia coffee: similar crops, but Colombia exports the equal of its whole harvest and Ethiopia about 59 percent. USDA and FNC data explain why.

Ethiopia and Colombia grow similar amounts of Arabica: 12.1 and 13.4 million 60 kg bags in 2026/27 on USDA forecasts. The difference that matters to a buyer is what happens after harvest. Colombia's exports in all forms equal 100 percent of its crop, 13.4 million bags out of 13.4 million. Ethiopia's equal 58.9 percent, 7.13 million out of 12.1 million. Colombia imports cheaper coffee for its soluble industry and home market. Ethiopia imports none, so every bag Ethiopians drink comes out of the pool a buyer can ship. Shares are our arithmetic from the USDA tables.
The 2025/26 stress test
Last season showed how each origin absorbs a shock.
| Thousand 60 kg bags, 2024/25 to 2025/26 | Colombia | Ethiopia |
|---|---|---|
| Change in production | -2,300 | +100 |
| Change in total exports | -567 | -465 |
| Total imports, 2025/26 | 2,454 | 0 |
| Domestic consumption, 2025/26 | 2,200 | 4,500 |
Colombia lost 2.3 million bags of crop and only 567,000 bags of exports. Ethiopia grew its crop and still shipped 465,000 bags less, because home use rose by 500,000.
Same hectares, less coffee
The USDA office in Bogota held harvested area at 640,000 hectares, so the whole fall was yield: about 1.39 tonnes per hectare in 2024/25 against 1.17 in 2025/26, our arithmetic. It explains the mechanism. Flowering needs a spell of moderate water stress, and continuous rain prevented it, caused early flower drop and raised rust pressure. Cenicafé measured rust incidence at 4.5 percent in January 2026, up from 3.9 percent in October 2025.
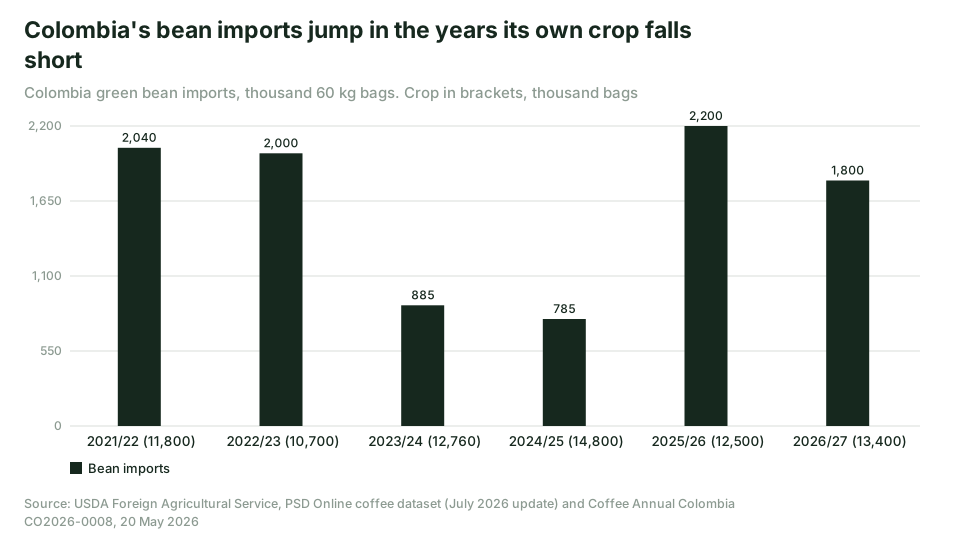
To keep its soluble export contracts and home market supplied, Colombia lifted imports to about 2.4 million bags, mainly lower quality coffee from Brazil, Peru and Ecuador. The chart shows the same pattern in the short crops of 2021/22 and 2022/23.
The Colombian growers' federation (FNC) has since closed the year, as reported by Portafolio: production of 12.65 million bags, down 15 percent, exports of 11.78 million, imports of 1.61 million and home use of 2.32 million. The USDA July figures are 12.5, 12.81, 2.45 and 2.2 million. We trust the FNC numbers for the finished season, because they are an out-turn and the USDA's are a forecast. We use the USDA for the comparison, because it measures both origins the same way. On FNC numbers, Colombia still exported 93 percent of its crop.
Colombia's edge
Colombia gets more coffee from each hectare: about 1.2 to 1.4 tonnes against Ethiopia's 0.9. The USDA reports that 87 percent of its coffee area is planted with rust resistant varieties. It has two harvests, October to December and the mitaca from April to June, which spreads shipments. In short years, imports cushion its export flow.
Ethiopia's case is growth. Its crop has risen 48 percent since 2021/22, but its export share depends on a home market that is still growing.
These export totals include roasted and soluble coffee in bean equivalent, which is how Colombia passes 100 percent in some years. Colombia ships about a million bags a year as soluble, and the USDA says imports help fill those contracts.
On the desk this month
- Colombia's main crop. The USDA forecast of 13.4 million bags needs an average of about 1.12 million a month. September 2026, the last month of the old year, came in at 1.215 million. Watch the FNC monthly figures through December.
- Origin on Colombian lots. Imports go mainly to soluble and lower grades. The Café de Colombia triangle mark guarantees 100 percent Colombian origin, so ask for it, or for the origin certificate.
- Ethiopian export pace. The USDA's 16 December 2026 report is the next test of the 7.1 million bag bean export forecast.
- EU dates. Use the European Commission's dates: 30 December 2026 for large and medium operators, 30 June 2027 for micro and small. The USDA Colombia report prints the older 2025 and 2026 dates.
If a Colombian programme needs an Ethiopian washed component, Kaffa Bridge can source it as the buyer's agent. The minimum is one full container load, with prices on enquiry.
Sources
- USDA Foreign Agricultural Service, Coffee: World Markets and Trade, July 2026
- USDA Foreign Agricultural Service, PSD Online coffee dataset (July 2026 update)
- USDA FAS Bogota, Colombia Coffee Annual, CO2026-0008, 20 May 2026
- Portafolio, October 2026: FNC balance of coffee year 2025/26 (production 12.65 million bags)
- European Commission, Regulation on deforestation-free products